Six interactive charts, ridiculously easy to use
Bubbles, radar, roadmaps, tier lists, brackets, branches. Six ways to sort out your ideas, settle arguments, or just have a good time.
did I mention it's free?
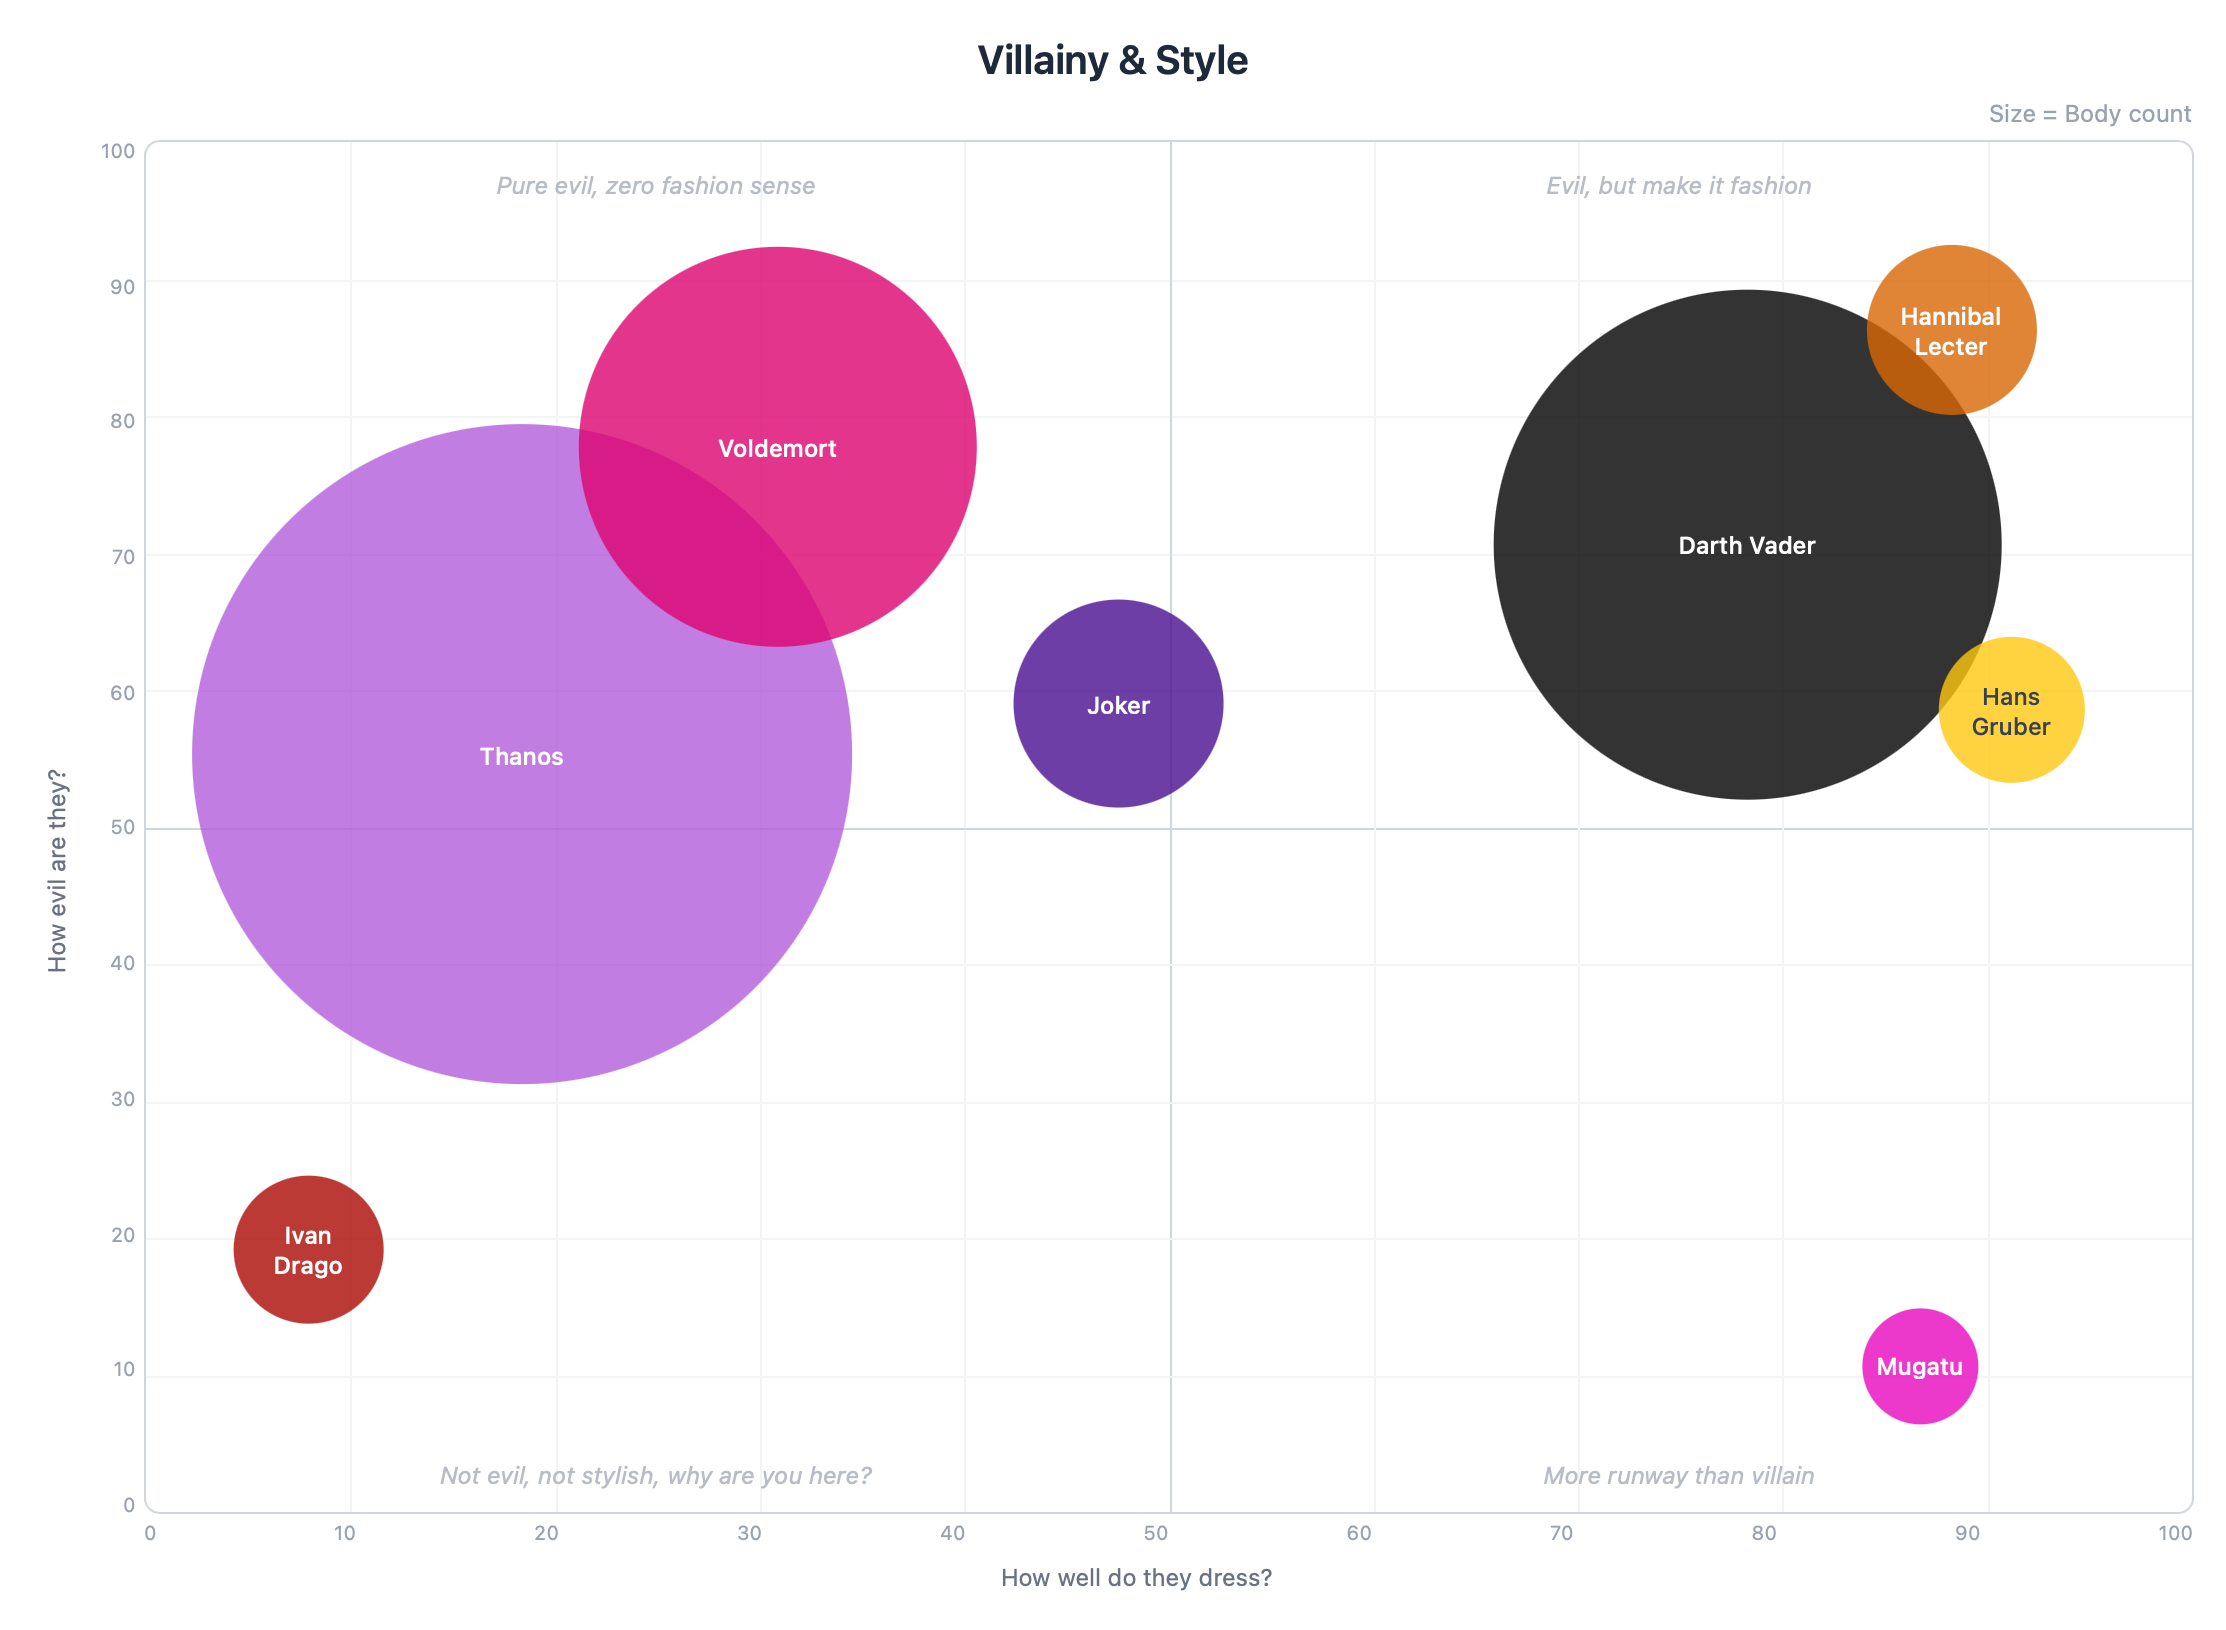
Compare your company's competitors or rank movie villains by villainy vs. style (with body count as bubble size). Your call.
Used by:
We've all been in that meeting

You know the one. Someone shares their screen with a spreadsheet no one can read. Half the team is yawning. The other half is checking their phones (you're not one of them, of course).
What if instead of that damn spreadsheet you used a bubble chart, a radar, or any of our six chart types that are ridiculously easy to use? Did I mention they're free?
Three steps. That's it. Period.
I promise it's 127.5% easier than using a spreadsheet.
Pick your chart
Bubbles, radar, roadmap, tier list, bracket, branches. If you can click (and right-click), you can make a chart.
Play
Move things around, change colors, name stuff whatever you want. It's your chart, you're the boss.
Share
Send a link and done. The other person doesn't need an account to see it.
I said you can do it in 3 steps... or just ask your AI assistant*
I told Claude "Create a radar chart comparing Rambo, Commando and RoboCop. With 7 axes of your choice, but make them funny." And this is what came out.
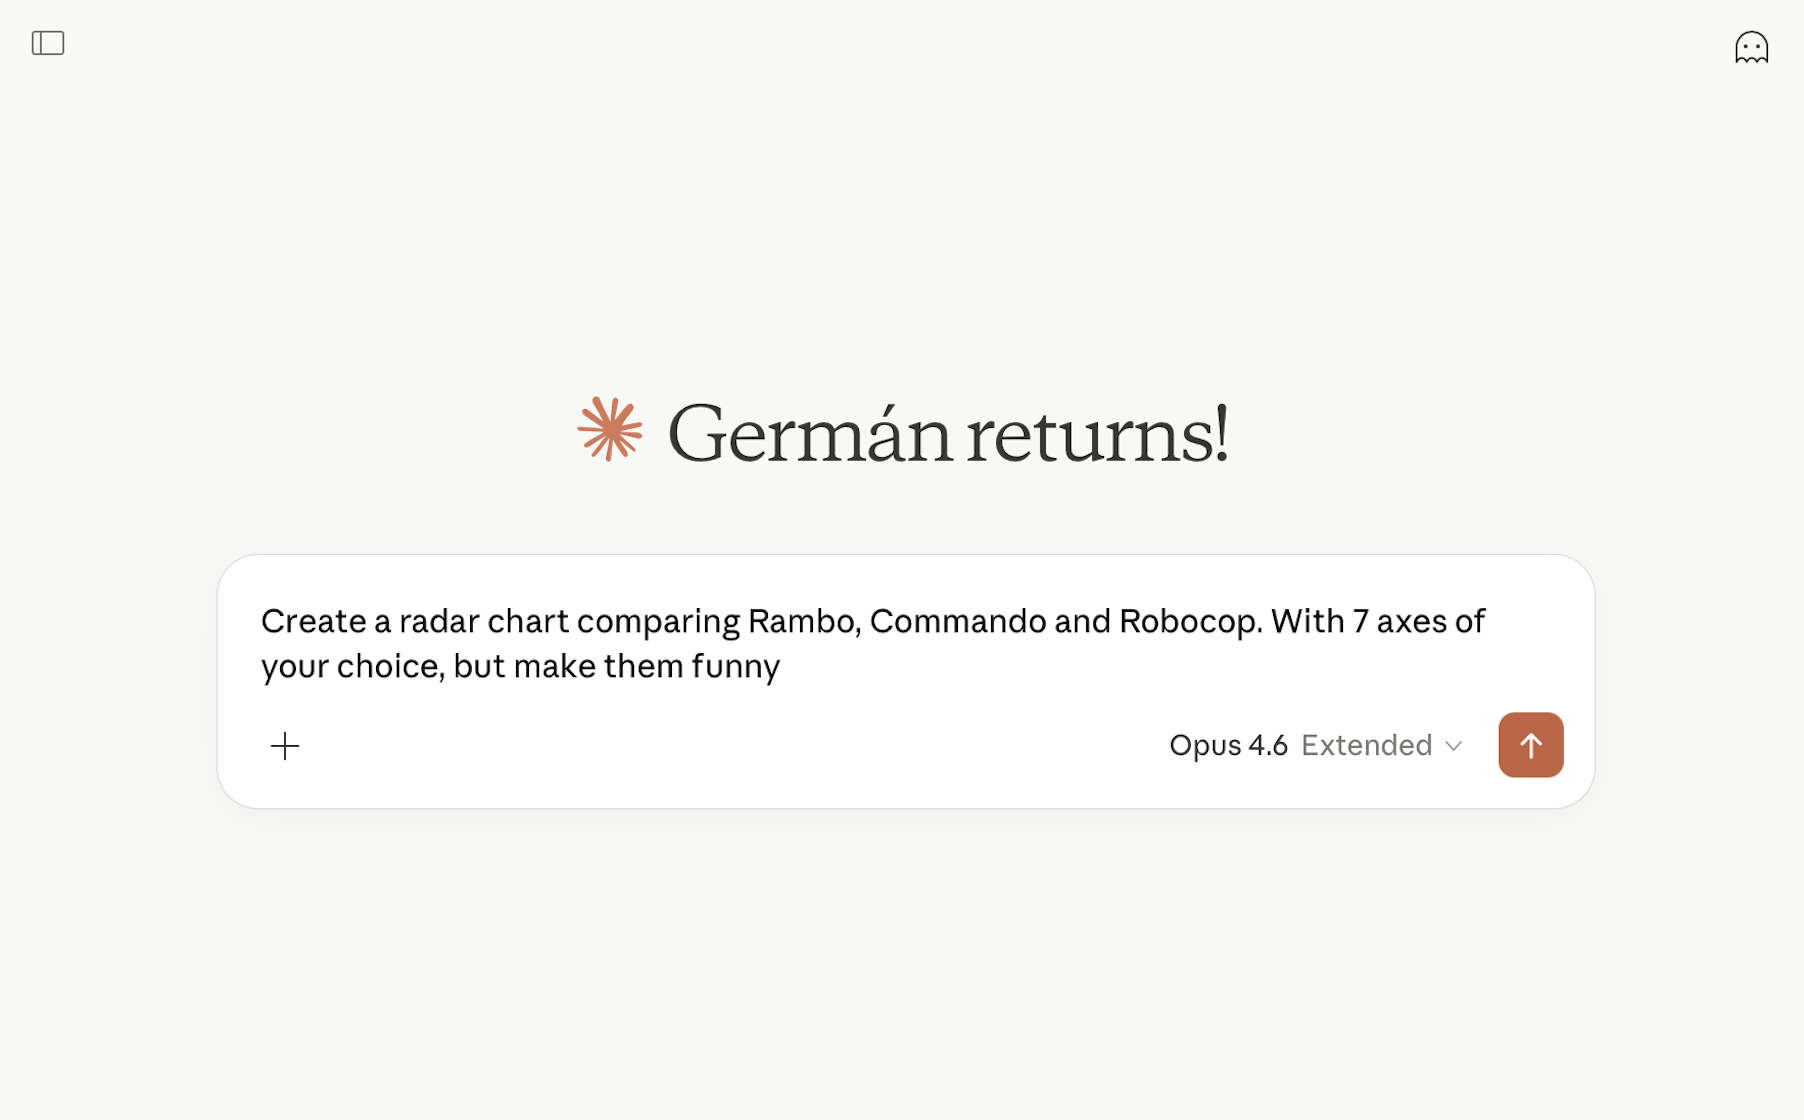
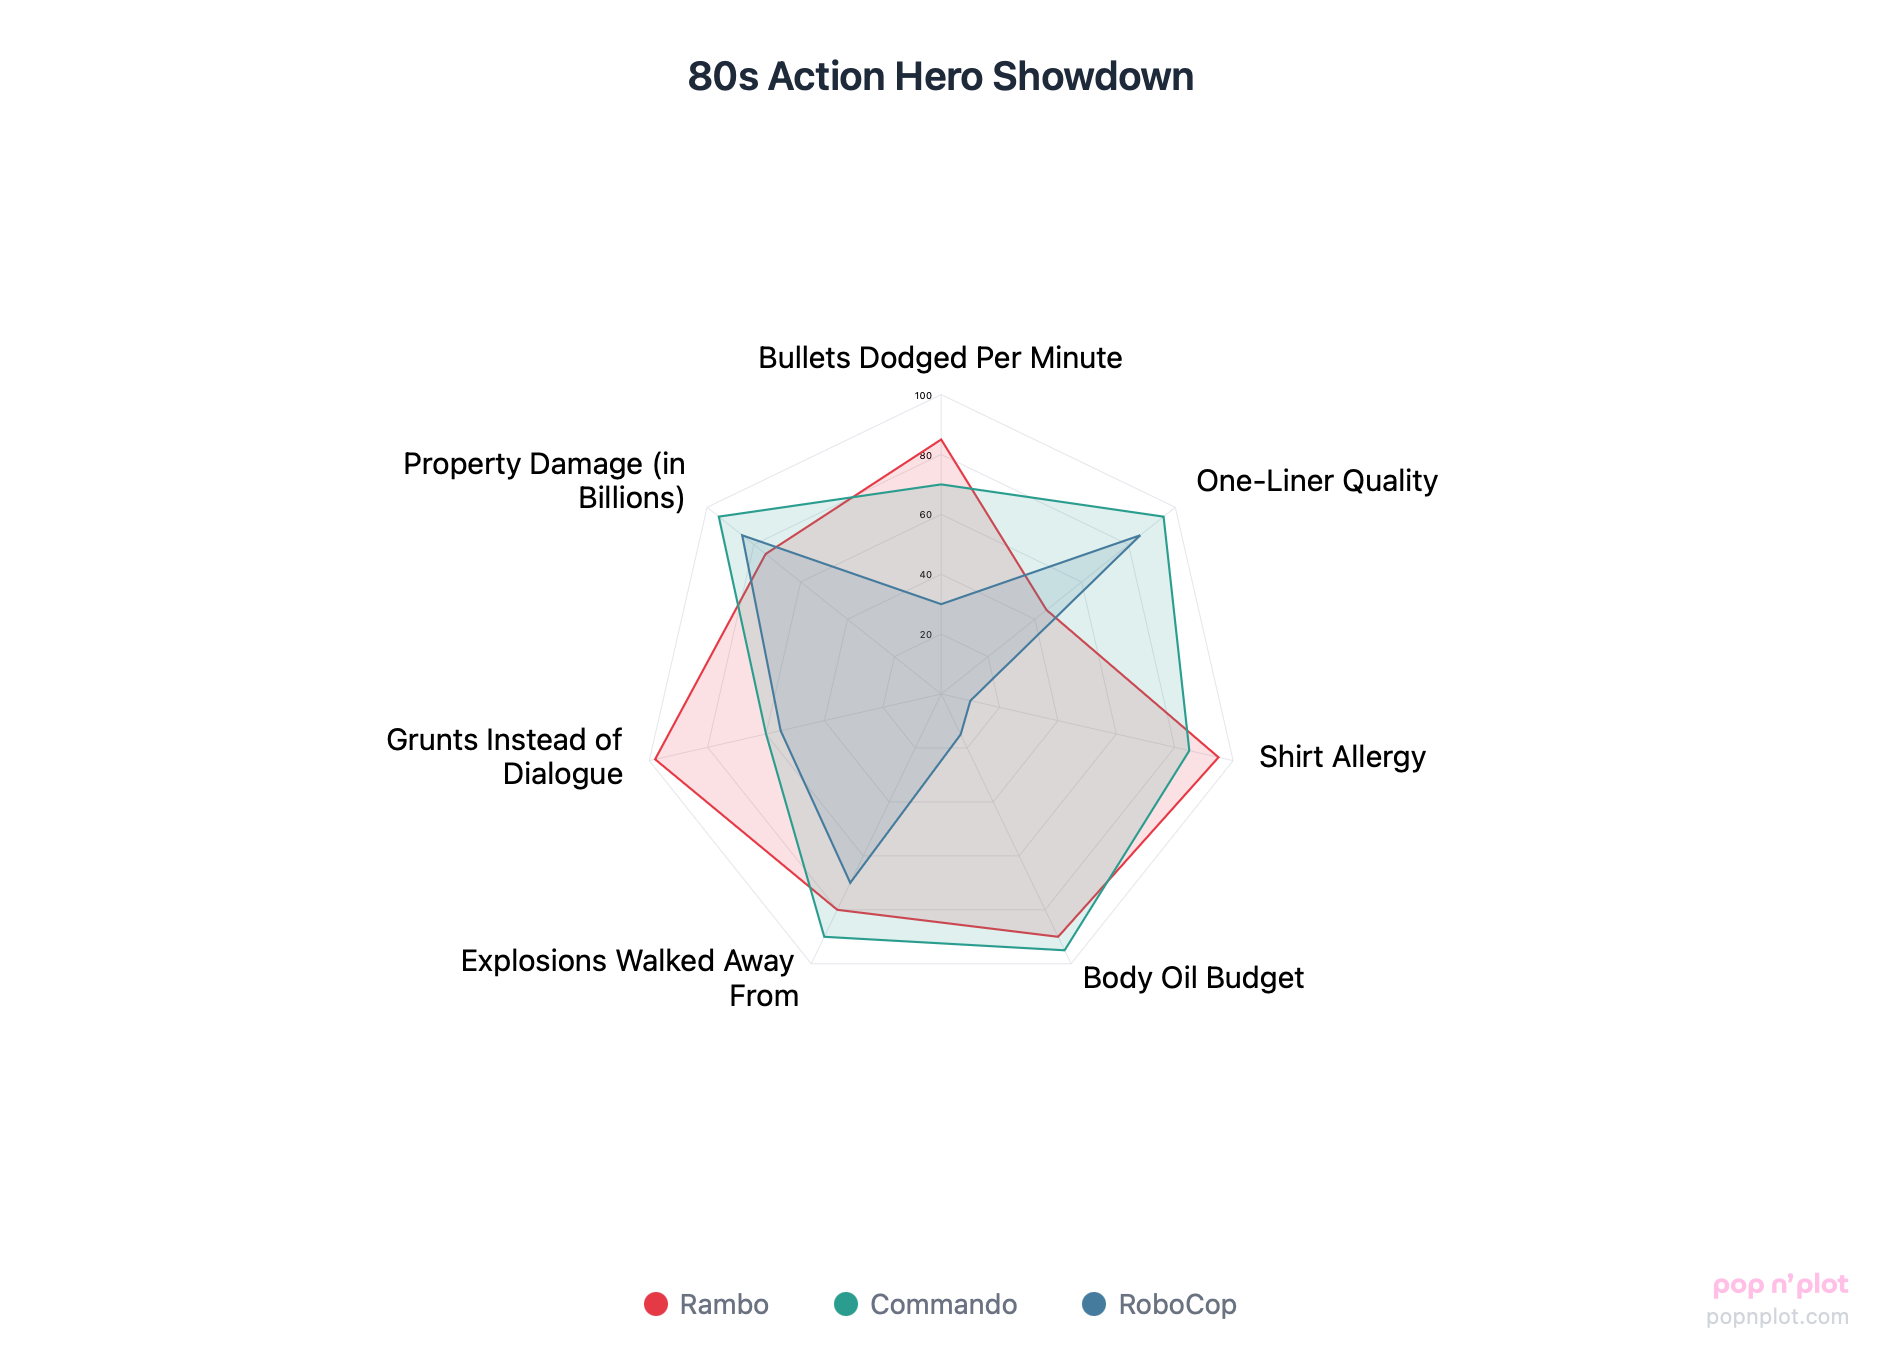
"80s Action Hero Showdown"... that was Claude, not me.
How to connect it (takes 30 seconds)
*Works with Claude today (my favorite)
6 ways to visualize just about anything
Because one chart type was never going to be enough for all the opinions you have.
Bubble Charts
The classic. Two axes, size by importance, and let's see what happens.
Radar Charts
Compare things across multiple dimensions at once. Looks like a spider web but feels professional.
Roadmaps
Plan your next moves on a timeline. Finally one that doesn't live in a Google Doc nobody reads.
Tier Lists
S-tier, A-tier, F-tier. Rank anything. Settle debates. Start new ones.
Tournament Brackets
Single elimination. Only one can win. Perfect for settling "what's the best X" once and for all.
Branches
From grandma's recipe to the project budget. Take something big and break it into pieces.
Six chart types, zero excuses.
Come on, one of them has to work for you.
did I mention it's free?
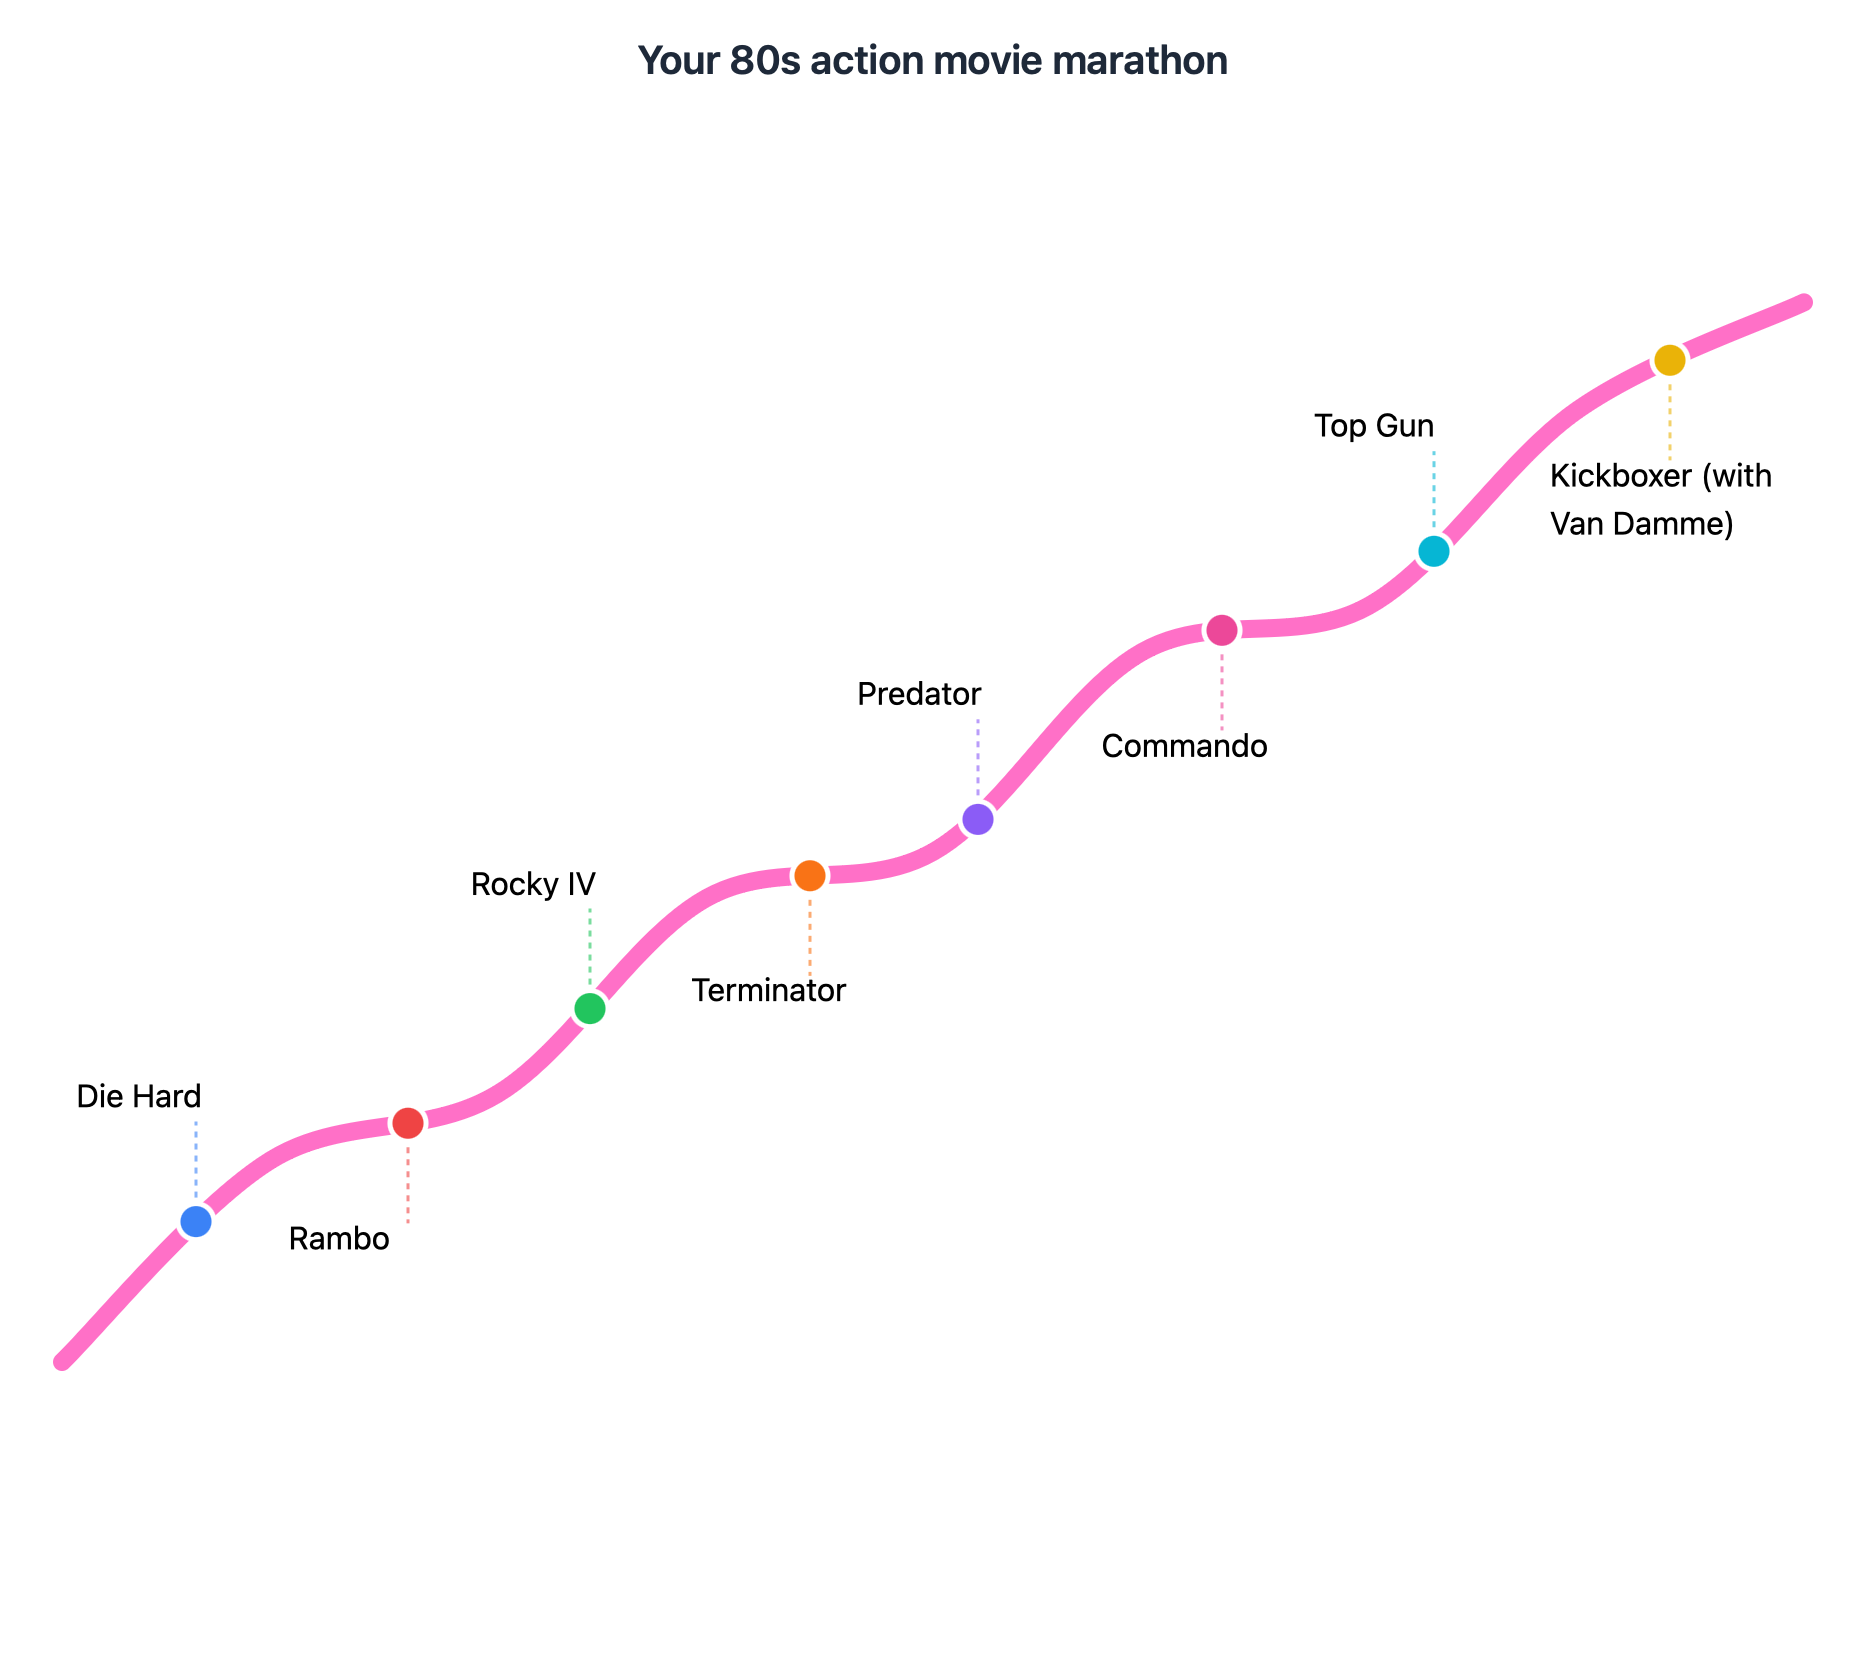
Your 80s action movie marathon
Start with Die Hard and Rambo to warm up. Rocky IV for the emotional part (RIP Apollo). Terminator and Predator for when there's no turning back. Commando and Top Gun to crank it up. And you close with Kickboxer because Van Damme is Van Damme.
A roadmap isn't just for planning projects. Sometimes it's for planning other things that are truly important.
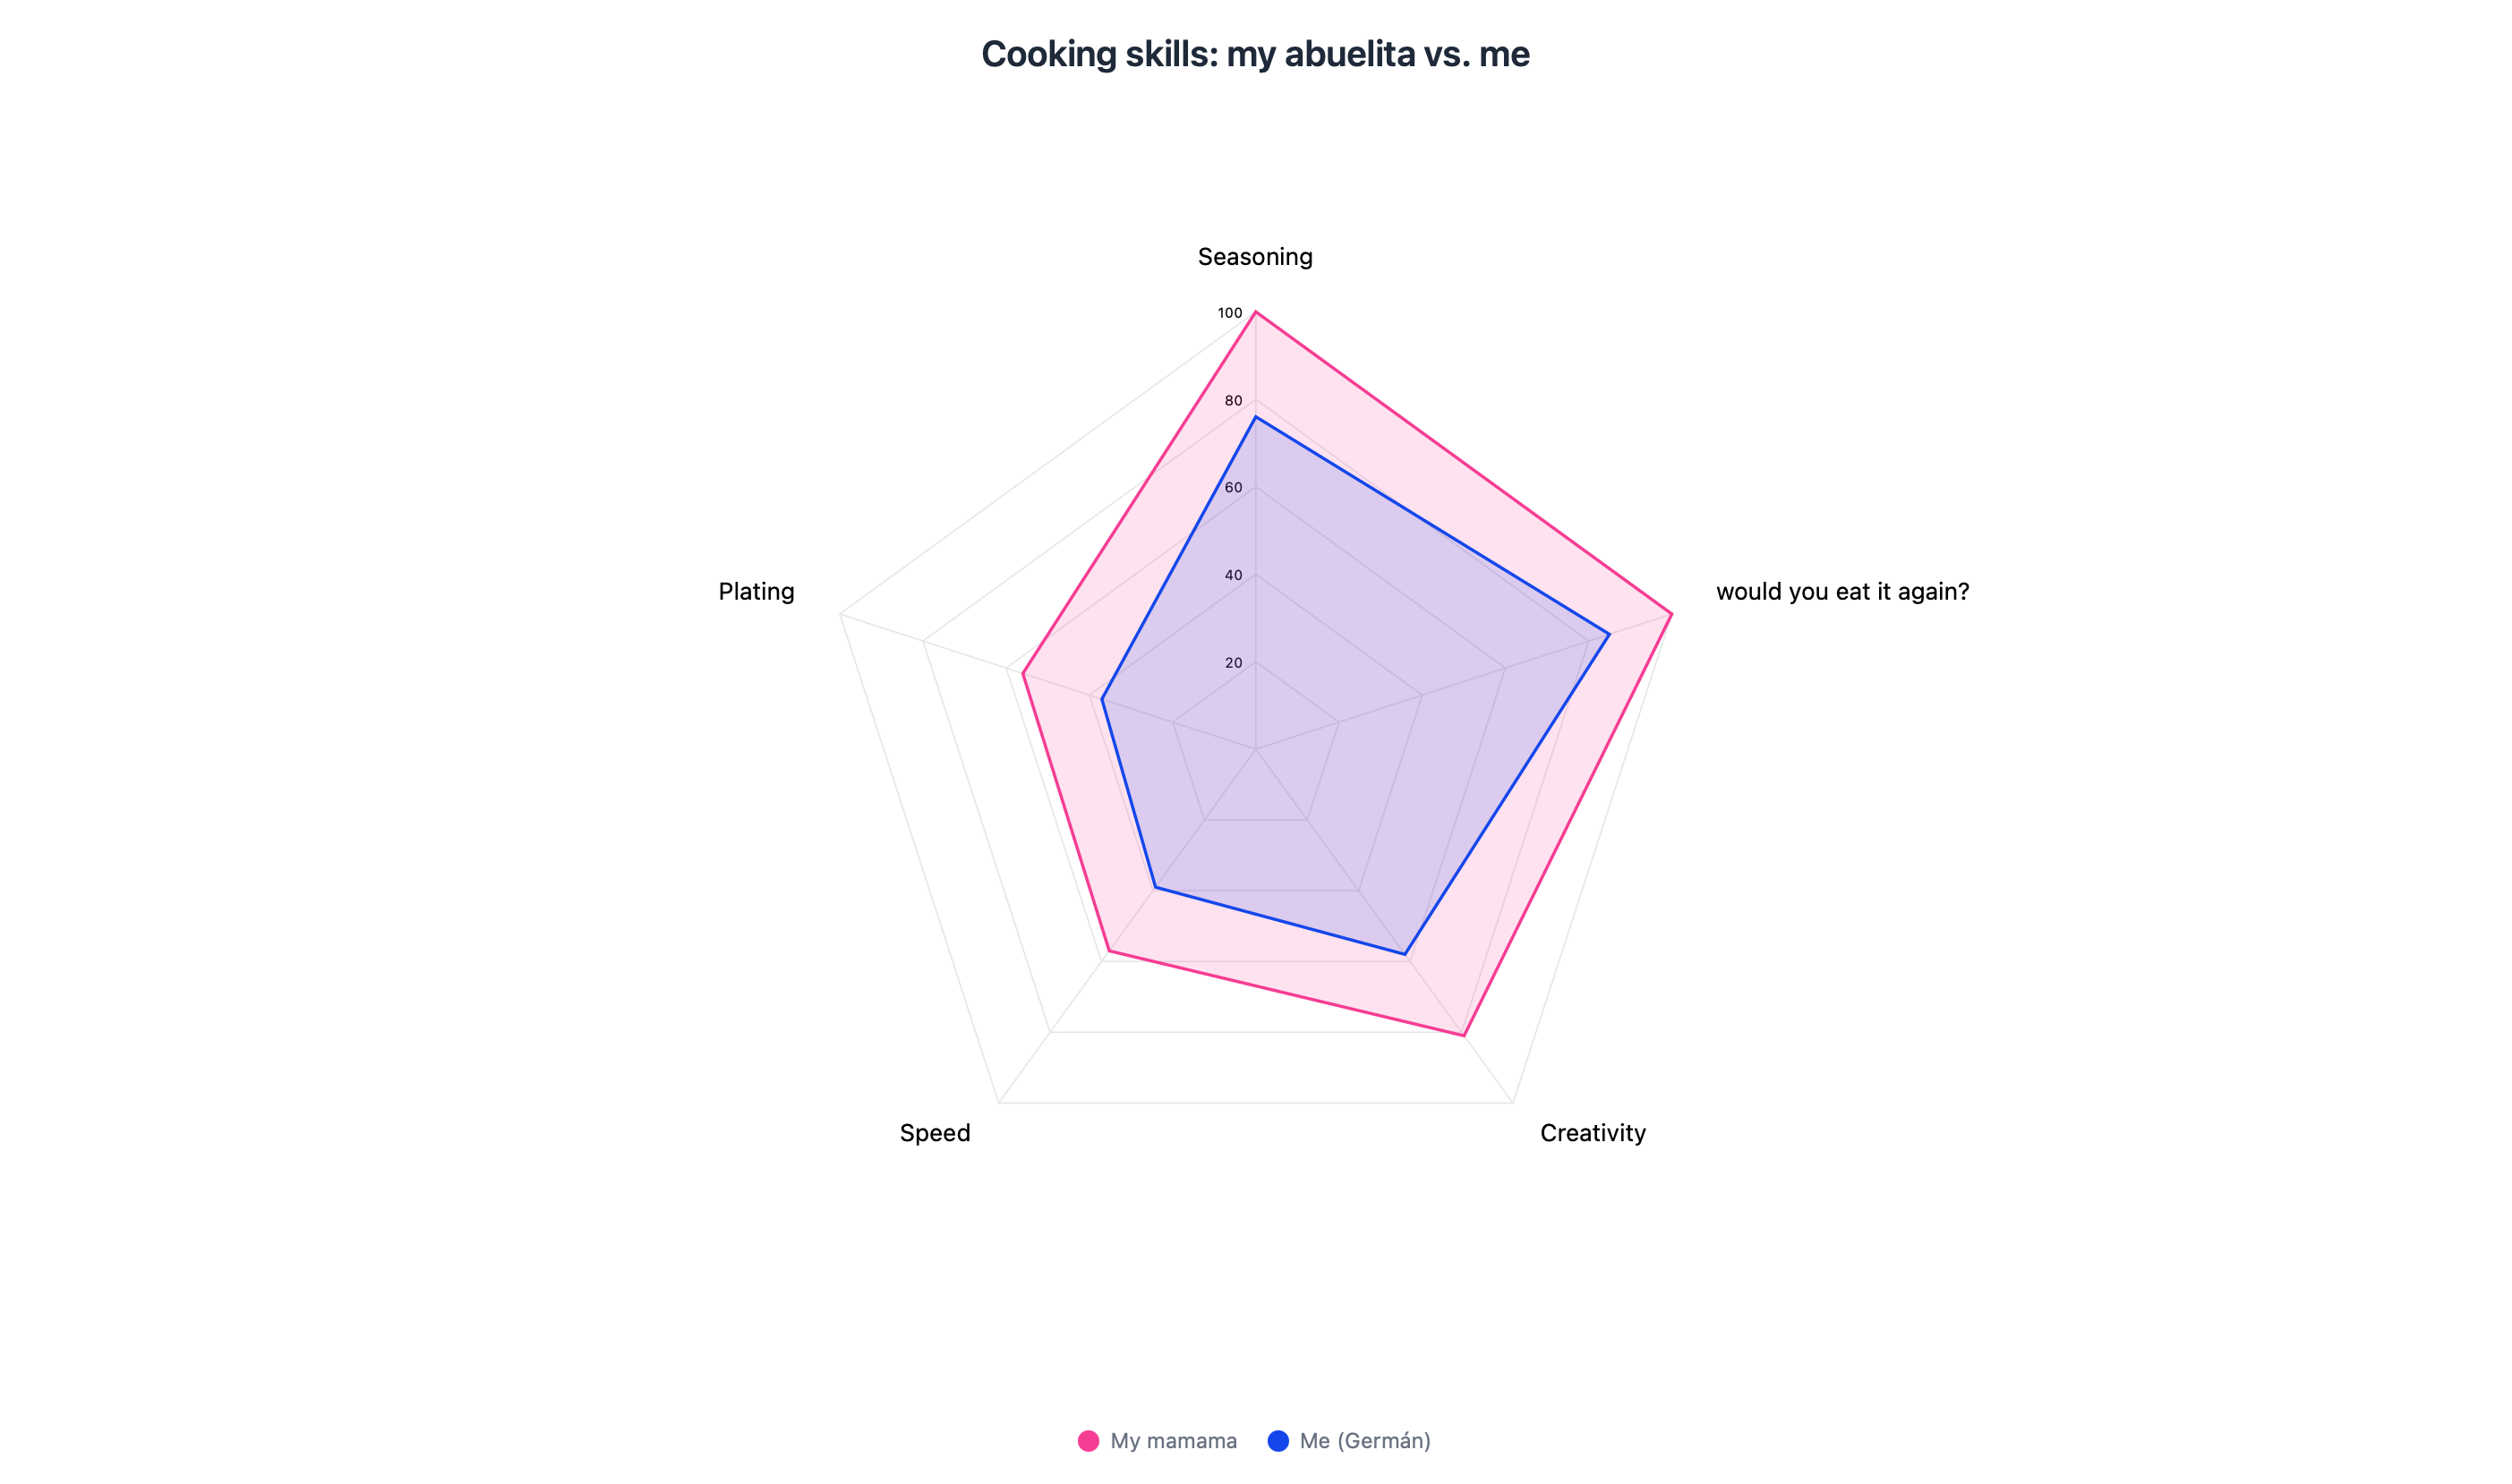
Cooking skills: my abuelita vs. me
My grandma (I call her mamama) has shared her recipes with me, I've copied every step, I've tried cooking her dishes dozens of times. I've got flavor, no complaints. But she's on another level.
Five axes: seasoning, plating, speed, creativity, and "would you eat it again?" Look at me there, that little blue shape, trying to compete. Not a chance.
Ranking Peruvian dishes (yes, we are extremely proud of our food)
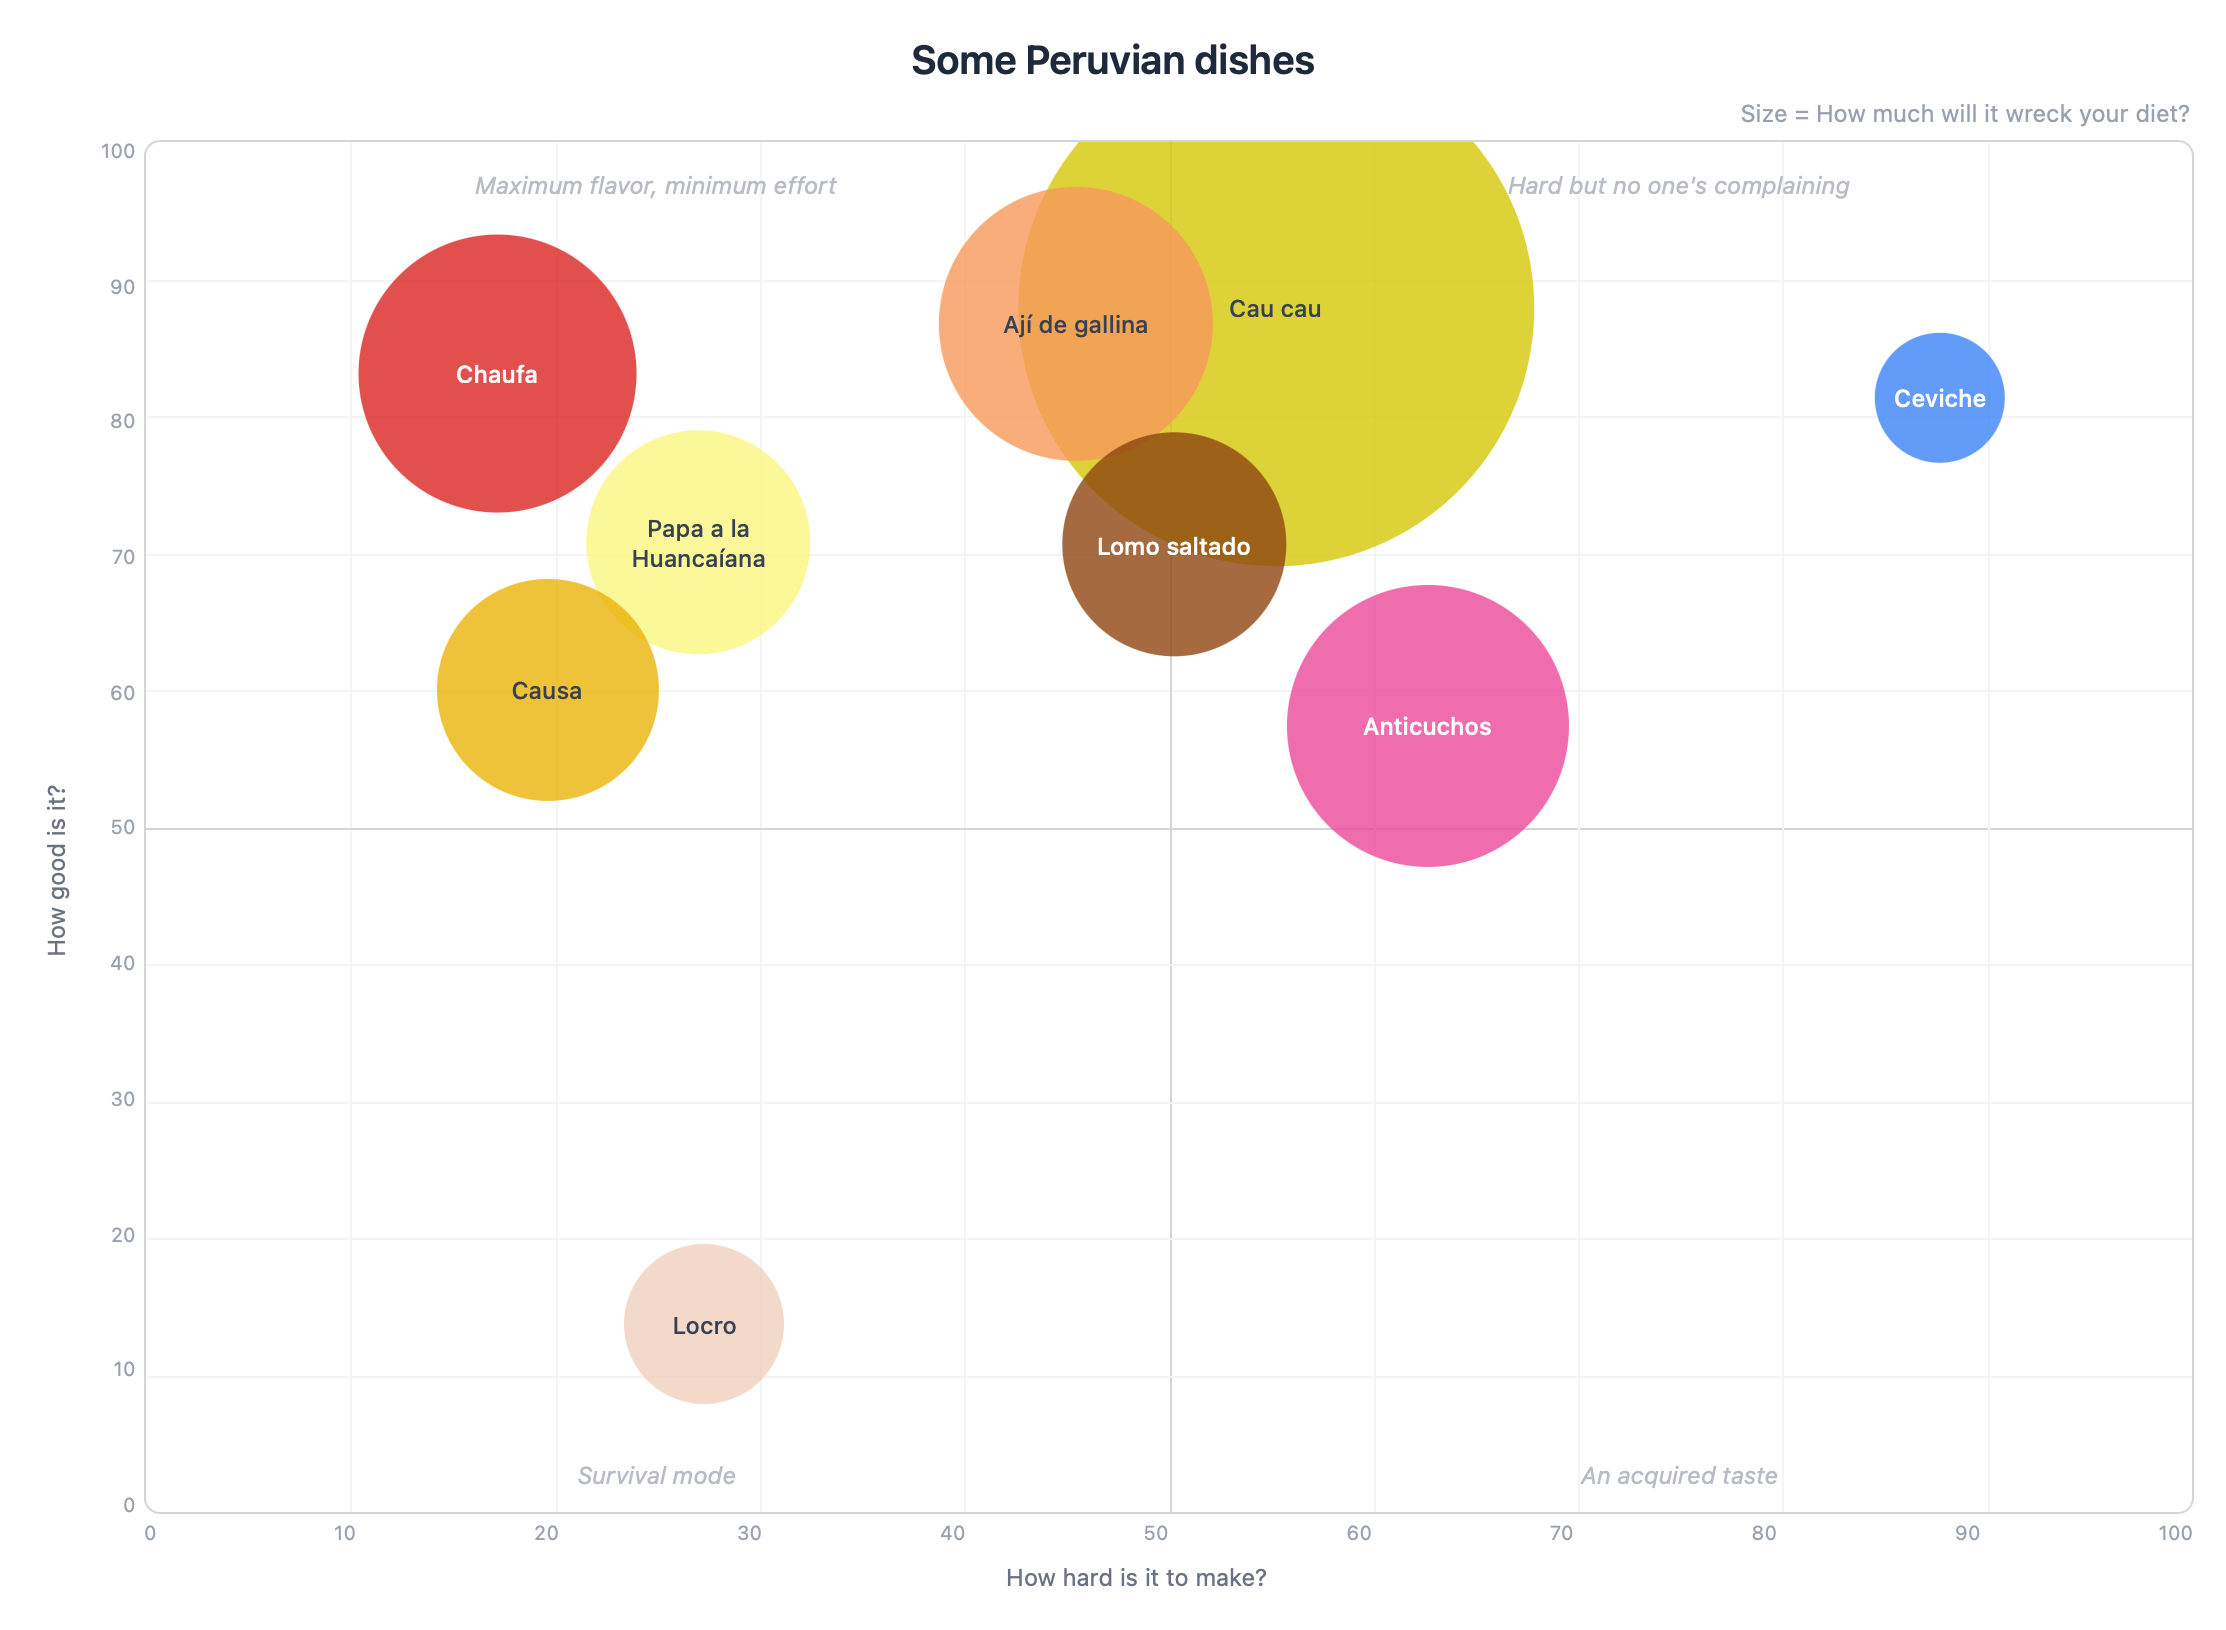
Someone had to do it. X axis: how hard it is to make. Y axis: how good it is. Size: how much it'll wreck your diet.
The result? Chaufa (Peruvian fried rice) top left, easy and delicious. Ceviche where it's always belonged, hard but worth every drop of lime. And cau cau taking over half the chart because it's my favorite dish and nobody's going to tell me that tripe and potatoes aren't fattening.
If you haven't tried Peruvian food, do yourself a favor. You'll thank me later.
OK seriously, stop reading and try it.
It's free. Takes 30 seconds. I'm not going to ask for your credit card.
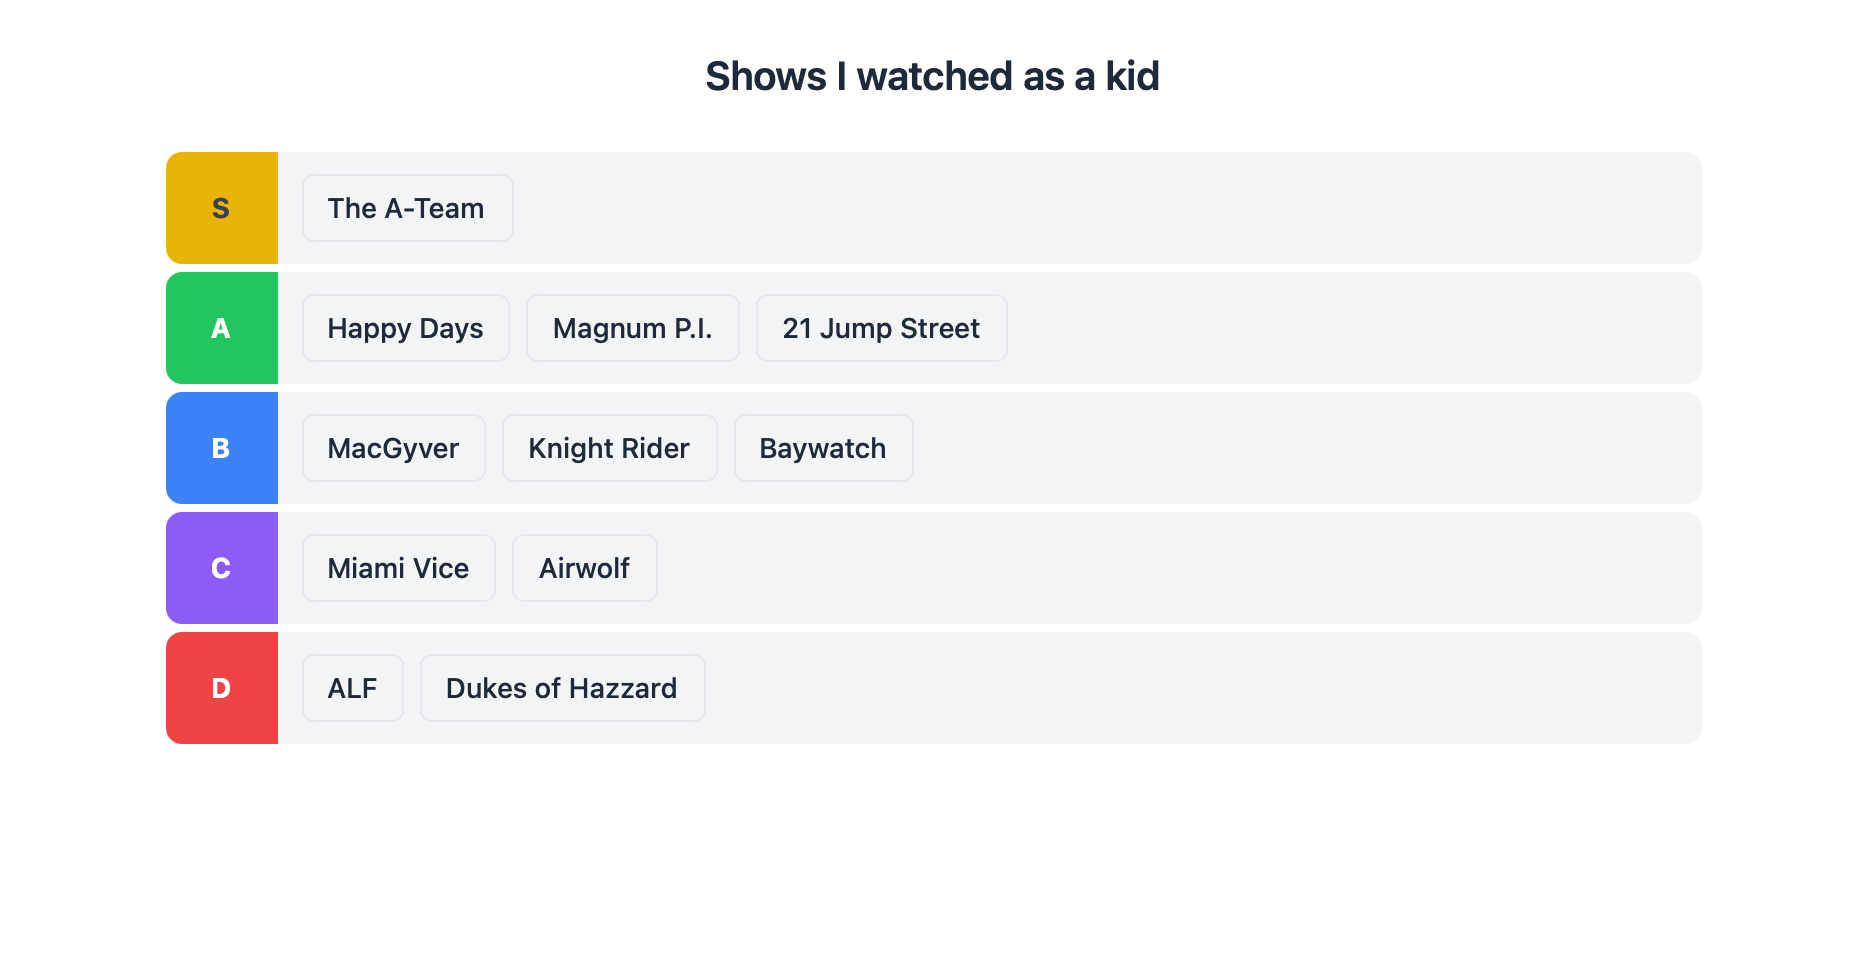
Ranking the shows I watched as a kid
S-tier: The A-Team. Alone. Because if you have a problem, if no one else can help, and if you can find them, maybe you can hire them. I don't need to say more.
Happy Days and Magnum in the A. MacGyver and Knight Rider in the B (fight me). ALF in the D because yes, I said it. A tier list is the only democratically accepted way to rank things on the internet. Don't fight it.
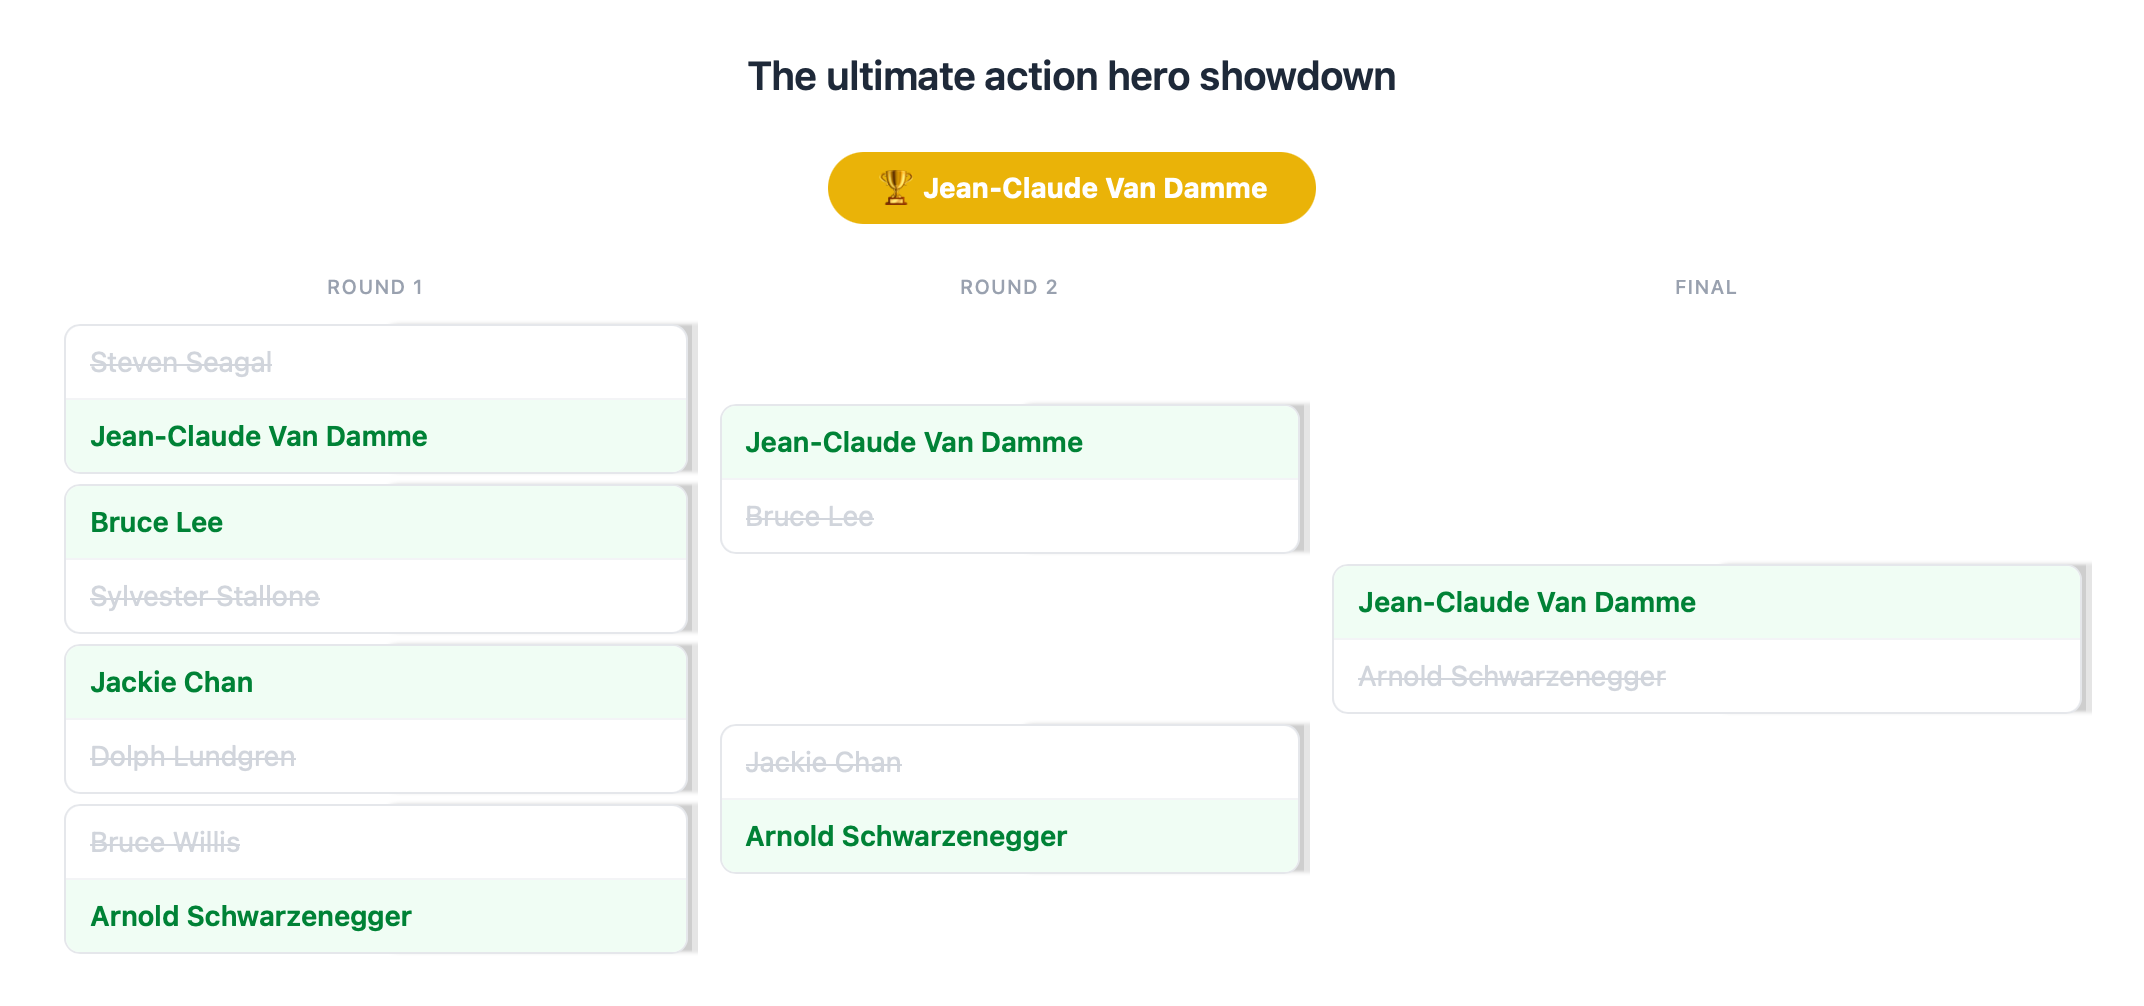
The ultimate action hero showdown
Van Damme vs Seagal. Bruce Lee vs Stallone. Jackie Chan vs Dolph Lundgren. Arnold vs Bruce Willis. Eight fighters, one champion. Single elimination, no appeals.
The result? Van Damme takes the tournament. Surprised? Me neither. A tournament bracket turns any debate into an event. Works for action heroes, but also for picking vendors, product names, or your team's best idea. Your group chat will never be the same.
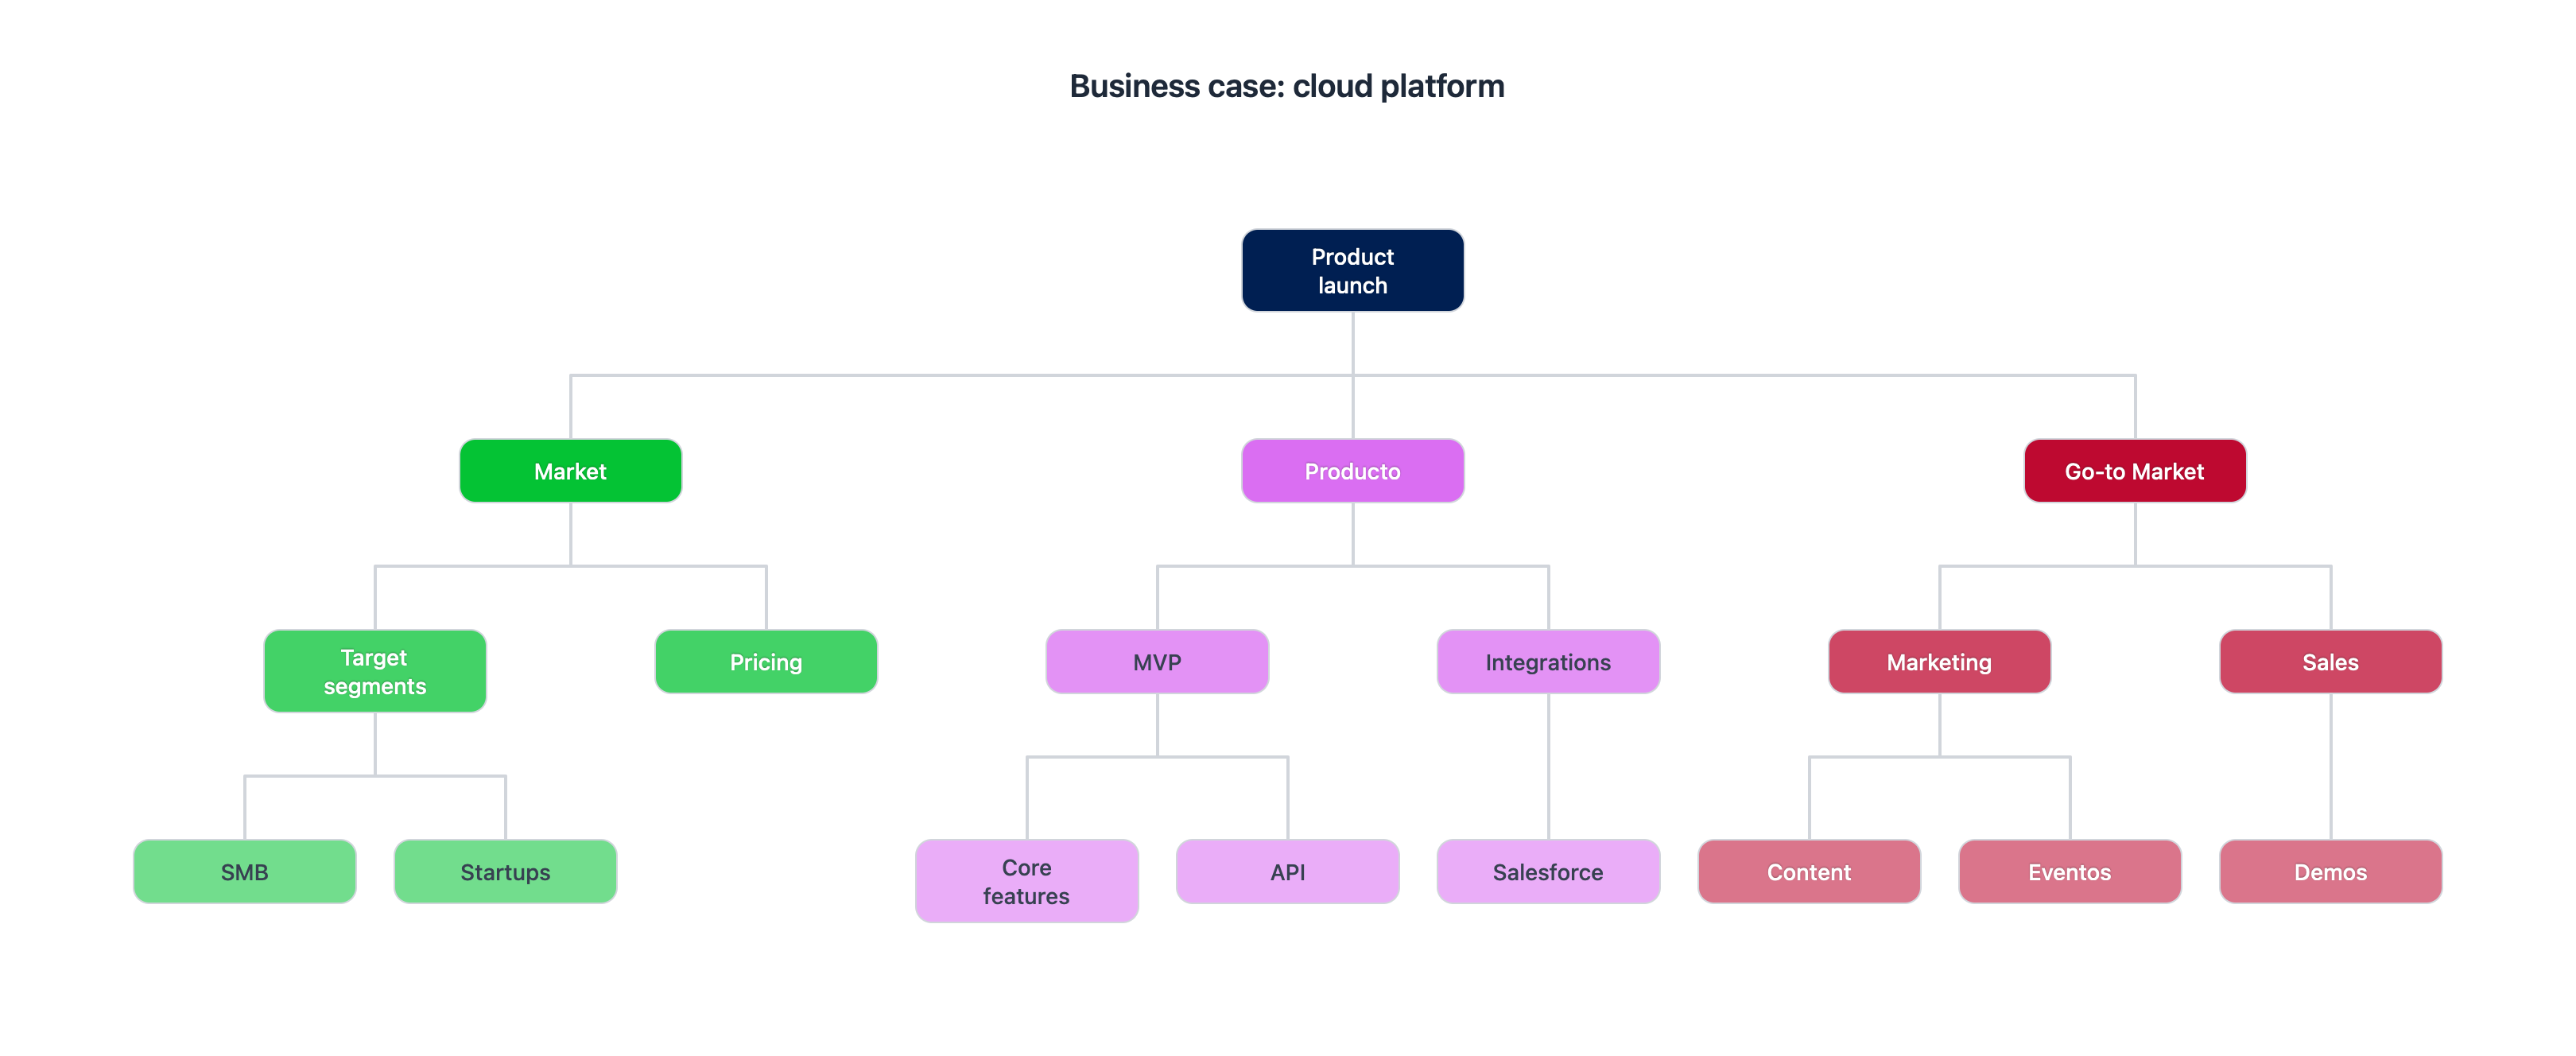
Cloud product launch (because I had to include something about business too, right?)
Sometimes you need to go deep on something, and the best way is to break it apart (and break it apart again). As the old saying goes: you eat an elephant one bite at a time.
I could have used the Star Wars saga as an example, but I wanted to show that this tool is also built for serious business. Who said having fun was off limits? That's the whole idea behind pop n' plot.
What people are saying (well, the few people who've tried it)
"Oh honey, the little colored circles are so pretty. I'm not sure what it's for but it looks very professional. Have you eaten?"
"I told him to stop making stuff up and go to bed. But honestly, it does make more sense than a spreadsheet."
"I used it to compare the chicken joints in the neighborhood. Now everyone asks me for the chart when they want to order chicken."
"I used it and my wife said it was the first useful thing I'd ever done on a computer."
"Is this like Excel? I like Excel. But ok, the colors are nice."
"Best charting tool I've ever used... (trust me, I built it 😅)"
This is getting long.
You and I both know you should be creating a chart instead of reading this.
Ok, here's what this thing can actually do
I built it for myself, so it has everything I needed.
6 chart types
Bubbles, radar, roadmaps, tier lists, brackets, branches. One tool, six ways to procrastinate productively.
Multi-select
Grab multiple elements at once and move them together. You're welcome.
Quadrants and axes
Give your quadrants creative names. If the BCG folks can put cows in a quadrant, you can put whatever you want.
Drag and drop everything
Bubbles, items, cards, matchups. Everything moves with the mouse. No editing cells like it's 1999.
Colors
There's a really nice color picker. Use it. I didn't build the whole thing for you to use grey (although if you want to use grey that's fine, who am I to judge?).
Undo
Undo, redo, across all chart types, always. Because everyone deserves a second chance.
Bulk import
Too lazy to create items one by one? Same. That's why you can paste a list and you're done.
Auto-save
Because it's 2026 and I'm not putting a "save as..." button.
Works with Claude
Describe what you want and the chart appears in your account. You tweak, you decide.
And a lot more
That you'll have to discover yourself. Actually, what are you doing still reading this? Why not just go try it?
pop n' plot vs. the old way
You know the old way. You've suffered through it. Let's not go back there.


Still here?
Look, I like you already. But I need you to go create a chart.
If you've ever had an opinion, this is for you
Doesn't matter who you are, at some point you're going to need to organize your ideas. Or someone else's.
The ones who charge by the quadrant. Now you can make them faster and charge the same.
Next time someone says "we need to prioritize," you already have the chart ready.
For comparing universities, majors, or jobs. Also works for comparing professors, but I didn't say that.
Show investors where you stand vs the competition. Looks more professional than a napkin.
Students build the chart together, discuss, and actually learn something. I think that's called interactive pedagogy (or something like that).
If you have something to organize, rank, plan, or debate, this is for you. If not, try it anyway.
FAQ (as in, frequently asked questions... well, "frequently" is a stretch)
Is it really free?
Yes. Free free. Not "free for 14 days and then we charge you." 5 charts, all 6 chart types, all features. Need more? The Pro plan is $9/month (or $90/year if you like saving money).
What types of charts are there?
Six: bubble charts (two axes and size), radar (multiple dimensions at once), roadmaps (timeline), tier lists (rank stuff), tournament brackets (single elimination), and branches (break something big into pieces). All included in the free plan.
Can I share my charts?
Yes. You get a link and send it however you want. WhatsApp, email, carrier pigeon. The other person doesn't need an account.
Can I export my charts?
PNG to drop into your PowerPoint and look good. More formats coming soon, give me time.
Is my data safe?
Your charts are saved in a database and only you can see them. Shared ones are read-only. I don't sell your data. I don't have anyone to sell it to.
Does it work on mobile?
Tablet yes. Phone... look, I tried, it works, but some chart types need more screen. I'd recommend something bigger.
Do I need to install anything?
Nothing. Zero. It's a website. If you can read this, you can use the tool.
What does the Pro plan give me?
Unlimited charts and early access to new features. $9/month or $90/year.
Can I create charts with AI?
Yes! pop n' plot works with Claude. Just describe what you want — "compare X by Y" or "rank these things" — and the chart appears in your account. To connect it: in Claude, go to Customize → Connectors → Add custom connector and paste https://popnplot.com/mcp. Takes 30 seconds.
The part where I tell you it's free and you don't believe me
There's a free plan that has almost everything. And a Pro plan for those who want more.
- ✓5 charts
- ✓All 6 chart types
- ✓Export as PNG
- ✓Share with a link
- ✓Multi-select
- ✓Colors, quadrants, everything
- ✓Undo / redo
- ✓Works with Claude
- ✓Unlimited charts
- ✓Everything in the free plan
- ✓A sincere thank you from Germán ❤️
Well, you made it to the end. That says a lot about you.
You saw bubble charts, radar charts, roadmaps, tier lists, brackets, branches, superheroes, villains, snack tournaments, and my family's testimonials... are you really not going to try it?
Free. 6 chart types. I've said it like 15 times now.
So, who made this thing?
Hi, I'm Germán! I live in Peru, I drink way too much coffee, and my favorite dish is cau cau (it's tripe and potatoes, don't knock it till you try it). Oh, I also write about AI at aprendiendoia.co.
Years ago I tried to launch a tool like this. I started coding it but six months later I had half-working code and very little energy left, so I killed the project... until a few days ago.
I was testing Claude Code (an AI coding assistant), trying to build a simple website... one thing led to another and I ended up coding this entire app over one very intense weekend.
Now you're reading the longest landing page in the world for a charting tool. I hope you like it and actually use it. If you want to know more about me read aprendiendoIA or add me on LinkedIn.
Abrazo,
